Aural fabric

This is a slightly modified version of a post that originally appeared on the Bela blog.

Alessia Milo is an architect currently researching education in acoustics for architecture while pursuing her PhD  with the audio engineering team here, as well as with the Media and Arts Technology programme.

She will present Influences of a Key Map on Soundwalk Exploration with a Textile Sonic Map at the upcoming AES Convention.

Here, she  introduces Aural Fabric, a captivating interactive sound installation consisting of a textile map which plays back field recordings when touched.

Aural Fabric is an interactive textile map allowing you to listen to selected field recordings by touching areas of the map that can sense touch. It uses conductive thread, capacitive sensing and Bela to process sensor data and play back the field recordings. The first map that was made represents a selection of sounds from the area of Greenwich, London. The field recordings of the area were captured with binaural microphones as part of a group soundwalk as part of a study on sonic perception. For the installation I chose recordings of particular locations that have a unique sonic identity, which you can listen to here. The textile map was created as a way of presenting these recordings to the general public.

When I created this project I wanted people to be able to explore the fabric surface of the map and hear the field recordings of the specific locations on the map as they touched it. An interesting way to do this was with conductive thread that I could embroider into the layout of the map. To read the touches from the conductive areas of the map I decided to use the MPR121 capacitive touch sensing board along with a Bela board.

Designing the map


I first considered the scale of the map based on how big the conductive areas could be in order to be touched comfortably, and on the limits of the embroidery machine used (Brother Pr1000E) . I finally settled on a 360mmx200mm frame. The vector traces from the map of the area (retrieved from OpenStreetMap) were reduced to the minimum amount needed to make the map recognizable and easily manageable by the embroidery PE-Design 10 software, which I used to transform the shapes into filling patterns.

Linen was chosen as the best material for the fabric base due to its availability, resistance and plain-aesthetic qualities. I decided to represent the covered areas we entered during the soundwalk as coloured reliefs completely made of grey/gold conductive thread. The park areas were left olive-green if not interactive and green mixed with the conductive thread if interactive. This was to allow the map to be clearly understood in its different elements. Courtyards we crossed were embroidered as flat areas in white with parts in conductive thread, whilst landmarks were represented with a mixture of pale grey, with conductive thread only on the side where the walk took place.

The River Thames, also present in the recordings, was depicted as a pale blue wavy surface with some conductive parts close to the sides where the walk took place. Buildings belonging to the area but not covered in the soundwalk were represented in flat pale grey hatch.

The engineering process

The fabric was meticulously embroidered with coloured rayon and conductive threads thanks to the precision of the embroidery machine. I tested the conductive thread and the different stitch configurations on a small sample of fabric to determine how well the capacitive charges and discharges caused by touching the conductive parts could be read by the breakout board.

The whole map consists of a graphical layer, an insulation layer, an embroidered circuit layer, a second insulation layer, and a bottom layer in neoprene which works as a soft base. Below the capacitive areas of the top layer I cut some holes in the insulation layer to allow the top layer to communicate with the circuit layer. Some of these areas have been also manually stitched to the circuit layer to keep the two layers in place. The fabric can be easily rolled and moved separately from the Bela board.

Some of the embroidered underlying traces. The first two traces appear too close in one point: when the fabric is not fully stretched they risk being triggered together!

Stitching the breakout board

Particular care was taken when connecting the circuit traces in the inner embroidered circuit layer to the capacitive pins of the breakout board. As this connection needs to be extremely solid it was decided to solder some conductive wire to the board, pass it through the holes beforehand, and then stitch the wires one by one to the correspondent conductive thread traces, which were previously embroidered.

Some pointers came from the process of working with the conductive thread:

  • Two traces should never be too close to one another or they will trigger false readings by shorting together.
  • A multimeter comes in handy to verify the continuity of the circuit. To avoid wasting time and material, it’s better to check for continuity on some samples before embroidering the final one as the particular materials and threads in use can behave very differently.
  • Be patient and carefully design your circuit according to the intended position of the capacitive boards. For example, I decided to place the two of them (to allow for 24 separate readings) in the top corners of the fabric.

Connecting with Bela:

The two breakout boards are connected through i2c to Bela which receives the readings from each pin of the breakout boards. The leftmost is connected through i2c to the other one, and this one goes to Bela. This cable is the only connection between the Fabric and Bela. It is possible to set an independent threshold for each pin, which will trigger the index releasing the correspondent recording. The code used to read the capacitive touch breakout board comes with the board and can be found here: examples/06-Sensors/capacitive-touch/.

MPR121 capacitive touch sensing breakout board connected to the i2c terminals of Bela.

The code to handle the recordings was nicely tweaked by Christian Heinrichs to add a natural fade in and fade out for the recordings. This code is based on the multi sample streamer example already available in Bela’s IDE which can be found here: examples/04-Audio/sample-streamer-multi/. Each recording has a pointer that keeps track of where the recording paused, so that touching the corresponding area again will resume playing from that point and not from the beginning. Multiple areas can be played at the same time allowing you to create experimental mixes of different ambiances.

Exhibition setting

This piece is best experienced through headphones as the recordings were made using binaural microphones. Nevertheless it is also possible to use speakers, with some loss of the spatial sonic image fidelity. In either case the audio output is taken directly from the Bela board. In the photograph below I made a wooden and perspex case for the board to protect it while it was installed in a gallery and powered the board with a USB 5V phone charger. Bela was set to run this project on start-up making it simple for gallery assistants to turn the piece on and off. The Aural Fabric is used for my PhD research, focused on novel approaches to strengthening the relationship between architecture and acoustics.  I’m engaging architecture students in sonic explorations and reflections on how architecture and its design contributes to defining our sonic environments.

Aural Fabric: Greenwich has been displayed at Sonic Environments in Brisbane among the installations and Inter/sections 2016 in London. More information documenting the making process is available here.
 

How does this sound? Evaluating audio technologies

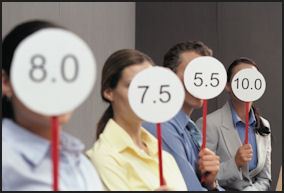
The audio engineering team here have done a lot of work on audio evaluation, both in collaboration with companies and as an essential part of our research. Some challenges come up time and time again, not just in terms of formal approaches, but also in terms of just establishing a methodology that works. I’m aware of cases where a company has put a lot of effort into evaluating the technologies that they create, only for it to make absolutely no difference in the product. So here are some ideas about how to do it, especially from an informal industry perspective.

– When you are tasked with evaluating a technology, you should always maintain a dialogue with the developer. More than anyone else, he or she knows what the tool is supposed to do, how it all works, what content might be best to use and has suggestions on how to evaluate it.

subjective evaluation details

– Developers should always have some test audio content that they use during development. They work with this content all the time to check that the algorithm is modifying or analysing the audio correctly. We’ll come back to this.

– The first stage of evaluation is documentation. Each tool should have some form of user guide, tester guide and developer guide. The idea is that if the technology remains unused for a period of time and those who worked on it have moved on, a new person can read the guides and have a good idea how to use it and test it, and a new developer should be able to understand the algorithm and the source code. Documentation should also include test audio content, preferably both input and output files with information on how the tool should be used with this content.

– The next stage of evaluation is duplication. You should be able run the tool as suggested in the guide and get the expected results with the test audio. If anything in the documentation is incorrect or incomplete, get in touch with the developers for more information.

– Then we have the collection stage. You need test content to evaluate the tool. The most important content is that which shows off exactly what the tool is intended to do. You should also gather content that tests challenging cases, or content where you need to ensure that the effect doesn’t make things worse.

– The preparation stage is next, though this may be performed in tandem with collection. With the test content, you may need to edit it, in order that its ready to use in testing. You may also want to create manually create target content, demonstrating ideal results, or at least of similar sound quality to expected results.

– Next is informal perceptual evaluation. This is lots of listening and playing around with the tool. The goal is to identify problems, find out when it works best, identify interesting cases, problematic or preferred parameter settings.

untitled

– Now on to semi-formal evaluation. Have focused questions that you need to find the answer to and procedures and methodologies to answer them. Be sure to document your findings, so that you can say what content causes what problem, how and why, etc. This needs to be done so that the problem can be exactly replicated by developers, and so that you can see if the problem still exists in the next iteration.

– Now comes the all-important listening tests. Be sure that the technology is at a level such that the test will give meaningful results. You don’t want to ask a bunch of people to listen and evaluate if the tool still has major known bugs. You also want to make sure that the test is structured in such a way so that it gives really useful information. This is very important, and often overlooked. Finding out that people preferred implementation A over implementation B is nice, but its much better to find out why, and how much, and if listeners would have preferred something else. You also want to do this test with lots of content. If, for instance only one piece of content is used in a listening test, then you’ve only found out that people prefer A over B for one example. So, generally, listening tests should involve lots of questions, lots of content, and everything should be randomised to prevent bias. You may not have time to do everything, but its definitely worth putting significant time and effort into listening test design.

Keeping Score for the Team

We’ve developed the Web Audio Evaluation Toolbox, designed to make listening test design and implementation straightforward and high quality.

– And there is the feedback stage. Evaluation counts for very little unless all the useful information gets back to developers (and possibly others), and influences further development. All this feedback needs to be prepared and stored, so that people can always refer back to it.

– Finally, there is revisiting and reiteration. If we identify a problem, or a place for improvement, we need to perform the same evaluation on the next iteration of the tool to ensure that the problem has indeed been fixed. Otherwise, issues perpetuate and we never actually know if the tool is improving and problems are resolved and closed.

By the way, I highly recommend the book Perceptual Audio Evaluation by Bech and Zacharov, which is the bible on this subject.

Physically Derived Sound Synthesis Model of a Propeller

I recently presented my work on the real-time sound synthesis of a propeller at the 12th International Audio Mostly Conference in London. This sound effect is a continuation of my research into aeroacoustic sounds generated by physical models; an extension of my previous work on the Aeolian harp, sword sounds and Aeolian tones.

A demo video of the propeller model attached to an aircraft object in unity is given here. I use the Unity Doppler effect which I have since discovered is not the best and adds a high-pitched artefact but you’ll get the idea! The propeller physical model was implemented in Pure Data and transferred to Unity using the Heavy compiler.

So, when I was looking for an indication of the different sound sources in a propeller sound I found an excellent paper by JE Marte and DW Kurtz. (A review of aerodynamic noise from propellers, rotors, and lift fans. Jet Propulsion Laboratory, California Institute of Technology, 1970) This paper provides a breakdown of the different sound sources, replicated for you here.

The sounds are split into periodic and broadband groups. In the periodic sounds, there are rotational sounds associated with the forces on the blade and interaction and distortion effects. The first rotational sound is the Loading sounds. These are associated with the thrust and torque of each propeller blade.

To picture these forces, imagine you are sitting on an aircraft wing, looking down the span, travelling at a fixed speed and uniform air flowing over the aerofoil. From your point of view the wing will have a lift force associated with it and a drag force. Now if we change the aircraft wing to a propeller blade with similar profile to an aerofoil, spinning at a set RPM. If you are sitting at a point on the blade the thrust and torque will be constant at the point you are sat.

Now stepping off the propeller blade and examining the disk of rotation the thrust and torque forces will appear as pulses at the blade passing frequency. For example, a propeller with 2 blades, rotating at 2400 RPM will have a blade passing frequency of 80Hz. A similar propeller with 4 blades, rotating at the same RPM will have a blade passing frequency of 160Hz.

Thickness noise is the sound generated as the blade moves the air aside when passing. This sound is found to be small when blades are moving at the speed of sound, 343 m/s, (known as a speed of Mach 1), and is not considered in our model.

Interaction and distortion effects are associated with helicopter rotors and lift fans. Because these have horizontally rotating blades an effect called blade slap occurs, where the rotating blade passes through the vortices shed by the previous blade causing a large slapping sound. Horizontal blades also have AM and FM modulated signals related with them as well as other effects. Since we are looking at propellers that spin mostly vertically, we have omitted these effects.

The broadband sounds of the propeller are closely related to the Aeolian tone models I have spoken about previously. The vortex sounds are from the vortex shedding, identical to out sword model. This difference in this case is that a propeller has a set shape which more like an aerofoil than a cylinder.

In the Aeolian tone paper, published at AES, LA, 2016, it was found that for a cylinder the frequency can be determined by an equation defined by Strouhal. The ratio of the diameter, frequency and airspeed are related by the Strouhal number, found for a cylinder to be approximately 0.2. In the paper D Brown and JB Ollerhead, Propeller noise at low tip speeds. Technical report, DTIC Document, 1971, a Strouhal number of 0.85 was found for propellers. This was used in our model, along with the chord length of the propeller instead of the diameter.

We also include the wake sound in the Aeolian tone model which is similar to the turbulence sounds. These are only noticeable at high speeds.

The paper by Martz et. al. outlines a procedure by Hamilton Standard, a propeller manufacturer, for predicting the far field loading sounds. Along with the RPM, number of blades, distance, azimuth angle we need the blade diameter, and engine power. We first decided which aircraft we were going to model. This was determined by the fact that we wanted to carry out a perceptual test and had a limited number of clips of known aircraft.

We settled on a Hercules C130, Boeing B17 Flying Fortress, Tiger Moth, Yak-52, Cessna 340 and a P51 Mustang. The internet was searched for details like blade size, blade profile (to calculate chord lengths along the span of the blade), engine power, top speed and maximum RPM. This gave enough information for the models to be created in pure data and the sound effect to be as realistic as possible.

This enables us to calculate the loading sounds and broadband vortex sounds, adding in a Doppler effect for realism. What was missing is an engine sound – the aeroacoustic sounds will not happen in isolation in our model. To rectify this a model from Andy Farnell’s Designing Sound was modified to act as our engine sound.

A copy of the pure data software can be downloaded from this site, https://code.soundsoftware.ac.uk/hg/propeller-model. We performed listening tests on all the models, comparing them with an alternative synthesis model (SMS) and the real recordings we had. The tests highlighted that the real sounds are still the most plausible but our model performed as well as the alternative synthesis method. This is a great result considering the alternative method starts with a real recording of a propeller, analyses it and re-synthesizes it. Our model starts with real world physical parameters like the blade profile, engine power, distance and azimuth angles to produce the sound effect.

An example of the propeller sound effect is mixed into this famous scene from North by Northwest. As you can hear the effect still has some way to go to be as good as the original but this physical model is the first step in incorporating fluid dynamics of a propeller into the synthesis process.

From the editor: Check out all Rod’s videos at https://www.youtube.com/channel/UCIB4yxyZcndt06quMulIpsQ

A copy the paper published at Audio Mostly 2017 can be found here >> Propeller_AuthorsVersion

Ten Years of Automatic Mixing

tenyears

Automatic microphone mixers have been around since 1975. These are devices that lower the levels of microphones that are not in use, thus reducing background noise and preventing acoustic feedback. They’re great for things like conference settings, where there may be many microphones but only a few speakers should be heard at any time.

Over the next three decades, various designs appeared, but it didn’t really grow much from Dan Dugan’s original Dan Dugan’s original concept.

Enter Enrique Perez Gonzalez, a PhD student researcher and experienced sound engineer. On September 11th, 2007, exactly ten years ago from the publication of this blog post, he presented a paper “Automatic Mixing: Live Downmixing Stereo Panner.” With this work, he showed that it may be possible to automate not just fader levels in speech applications, but other tasks and for other applications. Over the course of his PhD research, he proposed methods for autonomous operation of many aspects of the music mixing process; stereo positioning, equalisation, time alignment, polarity correction, feedback prevention, selective masking minimization, etc. He also laid out a framework for further automatic mixing systems.

Enrique established a new field of research, and its been growing ever since. People have used machine learning techniques for automatic mixing, applied auditory neuroscience to the problem, and explored where the boundaries lie between the creative and technical aspects of mixing. Commercial products have arisen based on the concept. And yet all this is still only scratching the surface.

I had the privilege to supervise Enrique and have many anecdotes from that time. I remember Enrique and I going to a talk that Dan Dugan gave at an AES convention panel session and one of us asked Dan about automating other aspects of the mix besides mic levels. He had a puzzled look and basically said that he’d never considered it. It was also interesting to see the hostile reactions from some (but certainly not all) practitioners, which brings up lots of interesting questions about disruptive innovations and the threat of automation.

wimp3

Next week, Salford University will host the 3rd Workshop on Intelligent Music Production, which also builds on this early research. There, Brecht De Man will present the paper ‘Ten Years of Automatic Mixing’, describing the evolution of the field, the approaches taken, the gaps in our knowledge and what appears to be the most exciting new research directions. Enrique, who is now CTO of Solid State Logic, will also be a panellist at the Workshop.

Here’s a video of one of the early Automatic Mixing demonstrators.

And here’s a list of all the early Automatic Mixing papers.

  • E. Perez Gonzalez and J. D. Reiss, A real-time semi-autonomous audio panning system for music mixing, EURASIP Journal on Advances in Signal Processing, v2010, Article ID 436895, p. 1-10, 2010.
  • Perez-Gonzalez, E. and Reiss, J. D. (2011) Automatic Mixing, in DAFX: Digital Audio Effects, Second Edition (ed U. Zölzer), John Wiley & Sons, Ltd, Chichester, UK. doi: 10.1002/9781119991298. ch13, p. 523-550.
  • E. Perez Gonzalez and J. D. Reiss, “Automatic equalization of multi-channel audio using cross-adaptive methods”, Proceedings of the 127th AES Convention, New York, October 2009
  • E. Perez Gonzalez, J. D. Reiss “Automatic Gain and Fader Control For Live Mixing”, IEEE Workshop on Applications of Signal Processing to Audio and Acoustics (WASPAA), New Paltz, New York, October 18-21, 2009
  • E. Perez Gonzalez, J. D. Reiss “Determination and correction of individual channel time offsets for signals involved in an audio mixture”, 125th AES Convention, San Francisco, USA, October 2008
  • E. Perez Gonzalez, J. D. Reiss “An automatic maximum gain normalization technique with applications to audio mixing.”, 124th AES Convention, Amsterdam, Netherlands, May 2008
  • E. Perez Gonzalez, J. D. Reiss, “Improved control for selective minimization of masking using interchannel dependency effects”, 11th International Conference on Digital Audio Effects (DAFx), September 2008
  • E. Perez Gonzalez, J. D. Reiss, “Automatic Mixing: Live Downmixing Stereo Panner”, 10th International Conference on Digital Audio Effects (DAFx-07), Bordeaux, France, September 10-15, 2007

The Mix Evaluation Dataset

Still at the upcoming International Conference on Digital Audio Effects in Edinburgh, 5-8 September, our group’s Brecht De Man will be presenting a paper on his Mix Evaluation Dataset (a pre-release of which can be read here).
It is a collection of mixes and evaluations of these mixes, amassed over the course of his PhD research, that has already been the subject of several studies on best practices and perception of mix engineering processes.
With over 180 mixes of 18 different songs, and evaluations from 150 subjects totalling close to 13k statements (like ‘snare drum too dry’ and ‘good vocal presence’), the dataset is certainly the largest and most diverse of its kind.

Unlike the bulk of previous research in this topic, the data collection methodology presented here has maximally preserved ecological validity by allowing participating mix engineers to use representative, professional tools in their preferred environment. Mild constraints on software, such as the agreement to use the DAW’s native plug-ins, means that mixes can be recreated completely and analysed in depth from the DAW session files, which are also shared.

The listening test experiments offered a unique opportunity for the participating mix engineers to receive anonymous feedback from peers, and helped create a large body of ratings and free-field text comments. Annotation and analysis of these comments further helped understand the relative importance of various music production aspects, as well as correlate perceptual constructs (such as reverberation amount) with objective features.

Proportional representation of processors in subjective comments

An interface to browse the songs, audition the mixes, and dissect the comments is provided at http://c4dm.eecs.qmul.ac.uk/multitrack/MixEvaluation/, from where the audio (insofar the source is licensed under Creative Commons, or copyrighted but available online) and perceptual evaluation data can be downloaded as well.

The Mix Evaluation Dataset browsing interface